What if research impact was co-created—not controlled—by researchers?
Imagine a landscape where communities, stakeholders, and academics collaborate as equals, shaping meaningful, measurable, and inclusive outcomes together.
Where research - from the very start - was designed for real-world application. And knowledge was democratised.
Sounds good, right?
The Problem
But, current stakeholder engagement attempts through in person workshops, webinars, or training follow a predictable pattern.
Researchers:
- set the agenda
- share their findings
- ask for questions or input
This doesn't always work for creating collaborative impact because audiences must feel a sense of ownership and stake in your research, rather than feeling spoken at. This isn't researchers' fault either - not all institutions train their academics on how to successfully engage stakeholders to generate real world change.
So, how do co-create change in a collaborative, engaging and democratic way?
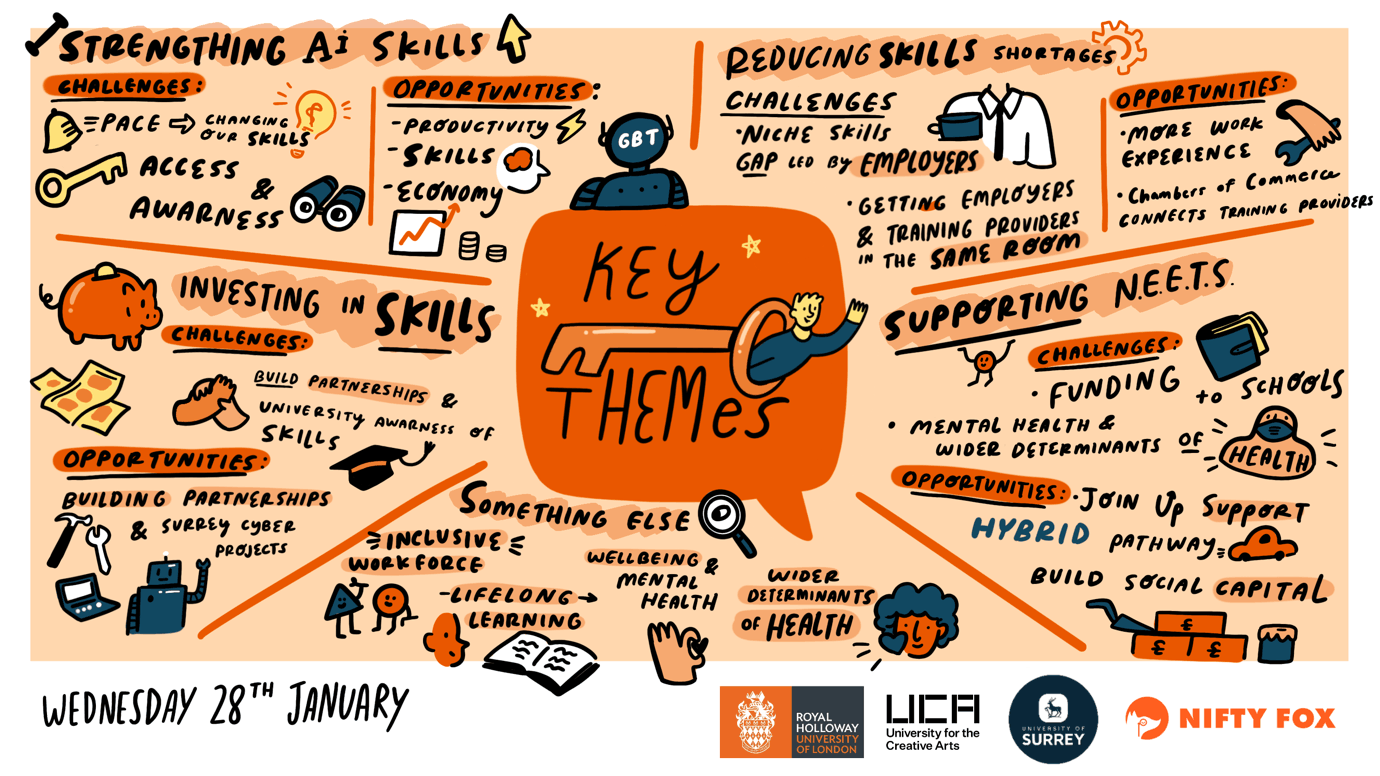
Generative scribing.
Let us introduce you to generative scribing (Bird, 2018).

It's a visual storytelling method that uses live illustration to dissolve traditional power dynamics in research interactions. Through art, visual narratives and collective drawing and thinking, participants and hosts shape interactions TOGETHER rather than by one power in the room. This allows for ALL expertise in the room to contribute to impact and dismantles the usual ‘research does impact to you’ power dynamic.
It's doing impact WITH people, NOT TO people.

But we know what you're thinking:
- I CAN'T DRAW!!
- I'LL BE LAUGHED OUT OF THE ROOM!?
- WHAT IF PEOPLE DERAIL THE DISCUSSION?
We got you.
- You don't have to be able to draw - we're going to give you all the tools below :)
- No, you won't - we'll show you how to prime the audience for a different kind of session, run it successfully and be known as an innovator - not an imposter.
- This is the whole point - you WANT those in the room to shape the discussion. This will show you how your research applies to real world practice, where the gaps are, and potential future research topics.
Feel reassured? Here's how you do it.
How to use generative scribing to co-create impact.
At the heart of Bird's approach is the concept of 'loving containers'. These are visual structures that help groups think, collaborate and shape change together.
Borrowing from participatory research, there are 6 'choice points' (Vaughn and Jacquez, 2020)- or 6 kinds of meetings - where you might come together with stakeholders to shape research and impact.
- To build partnership
- To design research questions
- To collect data
- To analyse data
- To share findings
- To drive action

For each kind of meeting, there is a visual container to guide your session - simple!
Before you start
- The Set Up - make sure your attendees are aware that it won't be the traditional 'powerpoint then chat' structure, and that you value their voice from the beginning. Share one overall outcome that you are hoping to achieve together, and ask them to reflect on the key question that your 'loving container' will address.
- Prepare Your Tools - big flipchart paper, pens and post its is all you need. Pre-draw your loving containers to save time.
- On The Day - start with a BRIEF overview of your research for context setting (this should be no more than 10 minutes - use our ReStory Rocket to help you). Then, split your room into small groups so everyone has an opportunity to contribute. Then set up the 'loving container' discussion that will be the bulk of your time together. Leave time at the end for each team to feedback, whilst the session leader (you the researcher) are creating one MEGA loving container that brings all points into one consensus vision. This can just be words written on the visual structure. Remember: look for commonalities and common themes - you shouldn't capture everything!
- Follow Up - take pictures of all the work done on the day. Follow up with key takeaways, and leave time for reflective learners to feedback on the work for a week or so afterwards too.
To build partnership, use 'The Net'
When building new relationships, it's important to find common ground.
Draw a simple tennis court on flipchart paper. Separate the room into two groups. Write down all of the concerns, goals and values of each member of the group on post its. Put them on either side of the net that corresponds to each group.
Come back together - talk through what each side wrote about. Select the commonalities and bring them into the centre of the net. Use these commonalities to co-create research areas or questions together.

To design research together, use 'Ideal Future'
Start with a collective discussion on what makes each person in the room 'mad, glad and sad' about the current context for the research. Use the emoji table to organise these ideas.
Then in smaller groups, get each group to choose their top rated 'mad, sad or glad' theme. Then - using the sunset visual structure - ask each group to reword their theme as a positive outcome for the future, and place it in the sun. Next, ask each group to think of 3 - 5 key things that research would need to address to achieve that future, and in what order.
By the end of the session, you will have multiple potential research focuses and questions. Bring the group back together to vote on the top theme and plan, and use the most popular to shape future research bids.

To collect data, use 'My Story'
Qualitative data collection doesn't just have to be an interview. Ask individuals, or groups to draw a line that represents their story relevant to the research question. That line could be wiggly and non-linear, or have big peaks and troughs, or lots of dead ends, or a steady incline upwards, depending on their journey. Ask them to write down why each part of the line looks the way it does, to tease out their experience. Participants could write it, draw it, speak it or use collage.
Then, compare stories and together pick out the commonalities. Together, you will have done a thematic analysis of participant narratives in themes that matter to lived experience.

To analyse data, use the 'Idea Beetle'
Ask the group to write (on post its of course!) all the key themes that have come up in the research data so far.
Then, come back together and group each theme into clusters - or themes that relate to one another.
Then, use the 'idea beetle' visual container to bring together one overarching theme as the beetle head, a brief explanation of that theme for the body, and then data examples that demonstrate it as the legs.
You'll end the session with multiple 'idea beetles' that combine together to create the skeleton for the discussion section of your work.

To share research findings, use the 'Newspaper Headline'
At the end of the research process, we need to communicate what's important to inspire change. But what?
Ask your stakeholder group to create a newspaper front cover.
- If the research had one big headline to change audiences, what would it be?
- What would the top three findings be to back up that headline?
- What image or visual would make those findings stick?
- And what would the key recommendations be?
Use each newspaper front page to inform how you communicate your research to decision-makers in policy briefs, summary reports, infographics and animations (we can help with that).

To drive action, use the 'Rocket'
We've got a whole free resource on this - grab it here. Use the ReStory Rocket framework to co-create messages together to inform communications to senior decision makers and those in power. Hopefully some of whom will be in the room with you!